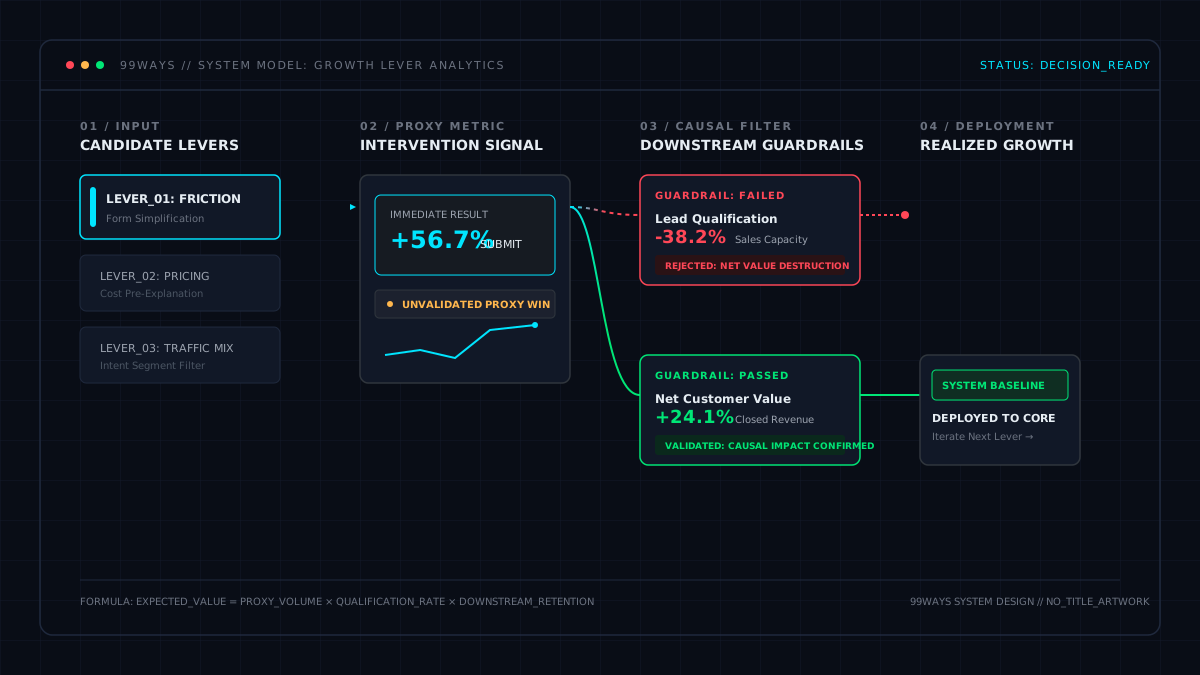


The best A/B testing metric is usually the measurable outcome closest to incremental contribution profit per eligible visitor, user, account, or other randomized unit.
Do not choose the event that fires fastest, the metric with the highest baseline rate, or the step most likely to reach statistical significance.
The word “closest” matters. In the broader Growth Lever Analytics method, the metric must judge whether acting on a controllable lever improved the business outcome. Profit may take months to observe or may be too sparse for a practical test. In that case, choose the highest-fidelity operational metric that can be measured reliably within the experiment horizon, and prove that it predicts the business outcome before allowing it to determine winners.
A useful hierarchy is:
- True decision metric: the outcome that would decide the experiment if fully observed.
- Operational primary metric: the best feasible metric used for the ship decision.
- Leading indicator or surrogate: an earlier signal that may predict the primary outcome.
- Guardrail: an outcome that must not deteriorate beyond an agreed limit.
- Diagnostic metric: evidence explaining why the treatment moved behavior.
- Data-quality metric: evidence that the comparison itself can be trusted.
Most metric mistakes come from allowing levels three or five to impersonate levels one or two.
The operational primary metric is often called the Overall Evaluation Criterion (OEC): the prespecified outcome used to compare variants and make the ship decision.
The six roles in an A/B testing metric plan
| Metric role | Question it answers | Example | Can it determine the winner? |
|---|---|---|---|
| True decision metric | Did the treatment create more durable business value? | Twelve-month contribution per eligible visitor | Yes, once sufficiently observed |
| Operational primary metric | What is the best trustworthy decision metric available within this test? | Ninety-day contribution per eligible visitor | Yes, with its horizon and limitations stated |
| Leading indicator or validated surrogate | Is the treatment moving an earlier behavior associated with later value? | Paid activation, qualified lead, successful task completion | Only if validated strongly enough for the decision |
| Guardrail | What must not deteriorate while the primary metric improves? | Refunds, churn, page speed, cancellations, safety incidents | It can veto or qualify a win |
| Diagnostic metric | Through which step or mechanism did behavior change? | CTA click, add to cart, error rate, step completion | No |
| Data-quality metric | Can the experiment result be trusted? | Sample-ratio mismatch, event join rate, missing revenue | It gates interpretation |
Microsoft’s experimentation practice uses a comparable taxonomy: Overall Evaluation Criterion metrics represent the product goal; feature and diagnostic metrics explain local behavior; guardrails protect dimensions that should not regress; and data-quality metrics determine whether the analysis is trustworthy. It also recommends that metrics be sensitive, trustworthy, efficient, debuggable, and interpretable. (Microsoft: During-experiment trustworthiness patterns)
Measure value per eligible randomized unit
The denominator should normally be the unit that could have received either treatment before the experiment affected behavior.
Measure per eligible user when users are randomized. If accounts are randomized, measure per eligible account. If sessions are randomized, measure per eligible session, provided that session assignment is valid for the decision.
For a commercial outcome over horizon \(H\), define the value of eligible unit \(i\) as:
\[ Y_i(H) = \text{net revenue}_i(H) – \text{variable costs}_i(H) – \text{treatment-specific costs}_i(H) \]
Non-buyers contribute zero revenue and any treatment-specific cost they incurred.
The treatment effect is the difference in average \(Y_i(H)\) between variants.
This is usually better than comparing:
- revenue per purchaser;
- LTV per subscriber;
- average order value among orders;
- close rate among qualified leads; or
- retention among users who activated.
Those conditional metrics can be useful diagnostically. They condition on a post-treatment population that the treatment may have changed.
A discount can attract more low-margin purchasers. A free trial can acquire more customers who churn. A simplified form can create more leads who never buy. The correct decision must include both the probability of reaching the outcome and the value conditional on reaching it.
Use incremental contribution, not allocated accounting profit
“Profit” in an experiment should usually mean contribution affected by the treatment, not corporate net income with arbitrary fixed-cost allocations.
Include costs that can change because of the variant:
- discounts and incentives;
- cost of goods;
- payment fees;
- fulfillment and shipping subsidies;
- returns and chargebacks;
- commissions;
- variable sales or support work;
- usage-based infrastructure or AI costs; and
- treatment-specific variable servicing costs.
Common acquisition cost usually cancels when users are randomized after acquisition. Include incremental media cost when the treatment itself changes spend, bidding, or channel allocation.
One-time design, engineering, or migration cost normally belongs in the deployment ROI and minimum-effect decision—not inside the per-user outcome—unless the cost scales with treatment usage.
Do not force unchanged rent, executive salaries, or historical software costs into a visitor-level experiment metric merely to call it profit.
The question is:
What incremental value would change if this treatment were deployed to the eligible population?
A/B testing metrics by business model and experiment type
| Business model or scenario | True decision metric | Acceptable operational primary metric | Leading indicators | Important guardrails |
|---|---|---|---|---|
| Ecommerce product page or checkout | Refund-adjusted contribution per eligible visitor | Net revenue per visitor when margin and costs are stable; purchase rate only when order economics cannot plausibly change | Add to cart, checkout start, payment attempt | AOV, margin, refunds, cancellations, page speed |
| Ecommerce discount, bundle, upsell, or free shipping | Contribution per eligible visitor | Short-horizon contribution per visitor | Offer acceptance, units per order, upsell take rate | Base conversion, margin, returns, fulfillment cost |
| Subscription acquisition or paywall | Expected contribution LTV per eligible visitor or account | Mature-window contribution per eligible unit; paid conversion when downstream economics are demonstrably stable | Trial start, checkout start, paid activation | Churn, refunds, payment failures, support and service cost |
| Subscription onboarding | Retained paid contribution per eligible signup or account | Validated activation metric or retained paid activation | Onboarding completion, key feature adoption | Trial conversion, early churn, support, errors |
| Subscription pricing or trial structure | Expected contribution LTV per eligible visitor or account | Observed contribution through mature billing cohorts plus prespecified residual-value model | Initial conversion, trial start, first payment | Churn, refunds, downgrades, customer mix, support cost |
| Lead generation | Expected contribution per eligible visitor | Qualified pipeline value or closed contribution per eligible visitor; qualified lead rate if validated | Form completion, booked call, attendance | Lead quality, no-shows, sales capacity, cancellation |
| Marketplace | Contribution per eligible user, transaction opportunity, or market | Completed transaction contribution with two-sided health constraints | Search, contact, request, acceptance | Fill rate, cancellation, wait time, supplier earnings and retention |
| Ad-supported or content product | Net monetization plus expected retained user value per eligible user | Net ad revenue per user with validated retention guardrails | Pageviews, sessions, content starts, ad impressions | Retention, satisfaction, diversity, latency, ad load |
| Infrastructure, AI, or cost-changing feature | Incremental user value minus variable service cost | Task success or product OEC plus explicit cost metric | Feature use, completion, latency | Reliability, safety, quality, crash rate, cost ceiling |
This table is a starting point. The treatment mechanism determines whether the simpler metric remains safe.
What metric should an ecommerce A/B test use?
Product-page and checkout experiments
The preferred economic metric is:
\[ \text{Contribution per eligible visitor} = \frac{ \text{collected revenue} – \text{discounts and refunds} – \text{product cost} – \text{payment fees} – \text{variable fulfillment and return handling} }{ \text{eligible visitors} } \]
Net revenue per visitor is a reasonable operational primary metric when:
- product mix is similar across variants;
- margin percentages are stable;
- discounting is unchanged;
- return and cancellation behavior is unlikely to change materially; and
- fulfillment costs do not differ.
Purchase conversion rate may be sufficient for a narrow checkout-friction or payment-reliability test when the treatment cannot reasonably alter order value, product mix, margin, or downstream quality.
Even then, monitor revenue per visitor, AOV, refunds, and payment errors as guardrails or confirmation metrics.
Add-to-cart rate, CTA clicks, checkout starts, and field completion are diagnostic. They explain the mechanism. They should not overrule a worse purchase or contribution outcome.
Discount, free-shipping, bundle, and upsell experiments
These treatments change economics by design. Conversion rate and revenue per visitor can both mislead.
A 15% discount may increase purchases and revenue while reducing contribution. A free-shipping threshold may increase AOV but create fulfillment losses. An upsell may increase order value while reducing base conversion or increasing returns.
Use contribution per eligible visitor and include:
- discount cost;
- incremental product cost;
- shipping subsidy;
- payment fees;
- return or cancellation cost; and
- any treatment-specific incentive.
Upsell take rate and AOV are useful mechanism metrics, not sufficient winner metrics.
Navigation, search, and merchandising experiments
Clicks on products or categories are too local.
Use downstream contribution or net revenue per eligible visitor when volume permits. Product clicks, search success, zero-result rate, filter use, and category depth should explain how the treatment changed discovery.
If the economic outcome is too sparse, a product-discovery metric can serve as an operational primary only after historical experiments or cohort data show that its treatment effects predict downstream value.
What metric should a subscription or SaaS A/B test use?
Acquisition, paywall, and trial experiments
The economic target is:
\[ \text{Expected contribution LTV per eligible visitor} = P(\text{acquisition}) \times E(\text{contribution LTV} \mid \text{acquired}) \]
The decomposition is useful for understanding the system. The experimental comparison should still be calculated per eligible visitor or account whenever possible.
Paid conversion can serve as the operational primary metric when the treatment is not expected to change:
- price;
- plan mix;
- trial behavior;
- customer quality;
- churn;
- refunds;
- usage-based cost; or
- acquisition channel composition.
When those assumptions are doubtful, paid conversion is only one component.
Onboarding and activation experiments
The true objective is not onboarding completion. It is retained customer value.
A good operational primary may be:
- retained paid activation per eligible signup;
- mature-window contribution per eligible account;
- renewal among subscriptions eligible to renew; or
- a validated activation event that reliably predicts retention and paid value.
An activation metric should specify the behavior, entity, and time window. “Used the product” is not a metric contract.
Onboarding completion, step progression, feature adoption, and time to value are leading or diagnostic metrics unless the organization has validated them against long-term outcomes.
Retention and renewal experiments
Use the population actually eligible for the lifecycle outcome.
Examples:
- renewal rate among subscriptions reaching renewal;
- retained contribution per eligible subscription;
- net revenue retention per eligible account;
- churn-adjusted contribution over a fixed maturity window.
Do not divide renewals by everyone exposed to a feature if many users never reached a renewal opportunity.
What metric should a pricing A/B test use?
For recurring products, pricing is one of the clearest cases where conversion rate can choose the wrong winner.
A pricing treatment can change:
- acquisition probability;
- plan selection;
- immediate revenue;
- trial-to-paid conversion;
- early and later churn;
- upgrades and downgrades;
- refunds and failed payments;
- usage and service cost;
- customer mix; and
- willingness to renew.
The true decision metric is expected contribution LTV per eligible visitor or account.
A practical decomposition is:
\[ \begin{aligned} \text{Expected contribution per eligible visitor} =&\ P(\text{paid}) \\ &\times E(\text{retained billing periods} \mid \text{paid}) \\ &\times E(\text{price} – \text{variable cost per period} \mid \text{paid}) \\ &+ \text{expected upsell contribution} \\ &- \text{refunds, incentives, and treatment costs} \end{aligned} \]
Do not compare only LTV among customers. The treatment changes who becomes a customer.
A 99ways pricing experiment
99ways tested four combinations of monthly price and free-trial availability.
The cheaper trial option produced the highest initial conversion rate and appeared to win early. After multiple billing periods, its churn and lower price changed the ranking. The no-trial, higher-price treatment produced more durable value despite converting fewer visitors. (99ways: Trial or no trial, $27 or $17)
The public case describes the business lesson. A later internal analysis expressed the comparison as modeled value per entrant, incorporating price, upsell revenue, and observed churn. In that analysis, the highest-converting variant ranked lowest on estimated value per entrant, while the lowest-converting variant ranked among the highest.
The model itself was not ground truth. Its value was that it forced the decision to include the economic trade-offs conversion rate ignored and made the remaining forecast uncertainty explicit.
How long should a pricing test run?
There is no universal answer.
Choose a maturity window that exposes the mechanisms the treatment can affect. A one-time ecommerce price test may mature at refund closure. A monthly subscription price test may require several renewal opportunities.
When the full horizon is impractical:
- report observed contribution through a fixed mature window;
- estimate residual value with a model specified before inspecting variant outcomes;
- validate the model on historical cohorts or experiments;
- report observed and modeled components separately;
- retain a holdout or continue post-deployment monitoring when the risk justifies it; and
- revise the decision if later realized value contradicts the forecast.
Microsoft’s research on long-term experiments uses pricing as a direct example: a higher price may increase short-term revenue while reducing long-term customer lifetime value through abandonment. It also warns that long-duration experiments introduce their own problems, including identity instability, survivorship bias, and selection effects. (Microsoft: Pitfalls of long-term online controlled experiments)
What metric should a lead-generation A/B test use?
The economic target is expected contribution per eligible visitor:
\[ \begin{aligned} \text{Expected contribution per visitor} =&\ P(\text{application}) \\ &\times P(\text{qualified} \mid \text{application}) \\ &\times P(\text{attended} \mid \text{qualified}) \\ &\times P(\text{closed} \mid \text{attended}) \\ &\times \text{contribution per sale} \\ &- \text{variable sales and servicing cost per visitor} \end{aligned} \]
The ideal experimental metric is closed contribution or qualified pipeline value per eligible visitor.
When sales are sparse or delayed, acceptable operational metrics may include:
- qualified lead rate per eligible visitor;
- attended qualified call rate;
- opportunity value per eligible visitor; or
- a prospect score validated against later sales and contribution.
Form submissions, booked calls, and CTA clicks are leading or diagnostic metrics.
99ways published a form experiment in which replacing descriptive questions with easier multiple-choice questions increased submissions by 56.7%. Lead quality, attendance, and purchase performance deteriorated. (99ways: Form Design That Sells)
Form completion was easy to measure and sensitive to the treatment. It was also the wrong winner metric.
What metric should a marketplace A/B test use?
A marketplace must protect both sides of the transaction.
A demand-side conversion improvement can reduce supplier quality, increase cancellations, lengthen fulfillment times, or make the market less attractive to future supply.
The economic target may be:
- contribution per eligible buyer;
- contribution per transaction opportunity;
- contribution per active market; or
- long-term marketplace contribution per buyer-seller cohort.
The randomization unit matters. Some marketplace treatments create spillovers: changing demand for treated buyers can affect prices, availability, or wait times for control buyers.
Common guardrails include:
- fill or match rate;
- acceptance;
- cancellation;
- delivery or wait time;
- supplier earnings;
- supplier retention;
- customer support and refunds; and
- geographic or inventory balance.
GMV is diagnostic unless platform revenue and variable costs move proportionally with it.
What metric should an ad-supported or content experiment use?
Pageviews, session length, and ad impressions are not automatically value.
A treatment can increase consumption while reducing satisfaction, diversity, or future retention. Spotify has documented the need to balance short-term engagement with broader user outcomes and uses primary metrics together with guardrails to catch regressions. (Spotify: Why personalization and experimentation use separate systems)
The economic target may combine:
- net advertising or subscription contribution per eligible user;
- probability of retained return;
- content-production or serving cost; and
- treatment-sensitive long-term value.
Leading indicators can include content starts, successful sessions, listening or reading time, and return frequency. They need validation against retention and monetization.
Guardrails may include satisfaction, content diversity, ad load, latency, complaint rate, or creator/supplier health.
What metric should a cost-changing, AI, or infrastructure experiment use?
Some treatments improve the user experience while increasing variable cost. Others reduce cost while risking quality.
Use a net-value decision:
\[ \text{Incremental net value per eligible unit} = \text{incremental user or business value} – \text{incremental variable cost} \]
Examples:
- an AI feature should balance task success, retained use, safety, latency, and token or compute cost;
- an infrastructure change may target cost or latency while product-level success and reliability remain guardrails;
- a support automation test may reduce handling cost while monitoring resolution, escalation, satisfaction, and churn.
Microsoft’s experimentation guidance for AI features explicitly separates utility, performance, safety, and utilization cost rather than optimizing feature engagement alone. (Microsoft: Metric framework for evaluating LLM features)
Profit proximity does not permit a treatment to violate safety, legal, contractual, or reliability constraints.
When can a leading indicator determine the winner?
Only when the organization has evidence that treatment effects on the proxy predict treatment effects on the true outcome.
Three levels of evidence should be distinguished.
Individual-level prediction
Users who activate tend to retain.
This is useful, but insufficient. The same variables that cause activation may cause retention without activation being the mechanism.
Cohort-level prediction
Cohorts with more activation tend to have higher retention or LTV.
Stronger, but still observational.
Experiment-level surrogacy
Across relevant randomized interventions, treatment effects on activation predict treatment effects on retention or LTV.
This is the evidence required when activation will replace retention as the decision metric.
Research on surrogate indices combines several short-term outcomes to estimate delayed treatment effects under explicit assumptions. The central lesson is not that every company needs a complex model. It is that replacing a delayed outcome with a short-term proxy is a causal claim requiring validation. (Athey et al.: The Surrogate Index)
Google has similarly studied immediate behavioral signals as surrogates for five-month revisit behavior and validated the selected signals in live experiments. (Google Research: Surrogate for long-term user experience)
A practical validation process is:
- define the long-term outcome;
- collect historical experiments with both short- and long-term maturity;
- test whether proxy effects predict long-term effects in direction and magnitude;
- validate on held-out experiments;
- document where the mapping fails;
- monitor drift as product and customer behavior change; and
- preserve the long-term metric as delayed confirmation.
A proxy that predicts customer value across people can still fail to predict what happens when the product deliberately moves that proxy.
Metric sensitivity matters, but it does not redefine success
A perfectly aligned metric that cannot detect a commercially meaningful effect within any feasible sample is not operationally useful.
Before launch, estimate:
- baseline mean or rate;
- variance and tail behavior;
- eligible sample size;
- outcome maturity;
- smallest effect worth acting on; and
- probability of detecting that effect under the planned design.
Microsoft distinguishes statistical power from movement probability: a metric must be capable of detecting an effect and plausibly move when the tested feature changes. It recommends historical movement analysis, variance reduction, transformed metrics, and carefully designed proxies when a long-term metric is too insensitive. (Microsoft: Metric sensitivity analysis)
If the economic metric is underpowered, the valid responses are:
- increase sample or duration;
- improve event and identity quality;
- reduce unexplained variance;
- choose a more eligible population using pre-treatment rules;
- use a validated surrogate;
- run a larger coherent treatment when the current treatment is too weak to move the economic outcome;
- retain uncertainty and avoid shipping; or
- choose a different research or rollout design.
“Use the nearest click because it reaches significance” is not a valid response.
Guardrails should constrain the decision before the result exists
A primary metric says what the experiment is trying to improve.
A guardrail says what the experiment is not allowed to damage.
Examples:
- contribution improves, but refund rate exceeds the limit;
- paid conversion improves, but ninety-day churn rises materially;
- task completion improves, but severe errors increase;
- infrastructure cost falls, but latency breaches the service threshold;
- ad revenue rises, but retained use or satisfaction deteriorates.
Define before launch:
- which guardrails can veto deployment;
- the practically unacceptable regression;
- the observation window;
- whether the rule applies globally or to a critical segment;
- how multiplicity is handled; and
- who can approve an explicit trade-off.
There is no universal formula for trading an OEC gain against a guardrail regression. Microsoft notes that organizations sometimes use predetermined weights or decision policies based on business priorities and historical experiments; those policies should exist before the specific result is known. (Microsoft: Post-experiment trustworthiness patterns)
Do not add several metrics after the test and choose whichever supports the preferred story.
Use fixed maturity windows for delayed outcomes
Subscription revenue, renewals, refunds, sales, and LTV are longitudinal outcomes.
A user acquired yesterday has had fewer opportunities to renew than a user acquired six weeks ago. Comparing all observed revenue without equal maturity gives early cohorts more exposure time.
Use cohort-based metrics such as:
- revenue within 30 days of assignment;
- contribution through the second renewal opportunity;
- refund-adjusted value after the return window;
- closed value within 90 days of lead creation; or
- retention at a specified eligible age.
Wait until each included unit has had the required opportunity to mature, or use an analysis method designed for censoring and longitudinal outcomes.
Report clearly:
- assignment date;
- maturity cutoff;
- event-time versus calendar-time field;
- late-arriving outcomes;
- censored units;
- modeled residual value; and
- whether post-test observation changed the conclusion.
The A/B testing metric-selection contract
Before implementation, complete this specification.
| Field | Required decision |
|---|---|
| Business decision | What will be deployed, rejected, or revised? |
| Eligible population | Who could receive either treatment before assignment? |
| Randomization and analysis unit | Visitor, user, session, account, market, or another unit |
| Economic equation | How does this population create incremental value? |
| True decision metric | What outcome would decide the test if fully observed? |
| Operational primary metric | What will determine the test decision within the available horizon? |
| Surrogate evidence | Why is any proxy expected to preserve the long-term decision? |
| Leading indicators | Which early behaviors explain movement? |
| Guardrails | What cannot regress, and by how much? |
| Diagnostics | Which funnel and mechanism metrics will explain the result? |
| Data-quality gates | SRM, exposure, event validity, joins, missingness, reconciliation |
| Maturity window | When is the outcome sufficiently observed? |
| Authoritative source | Billing, ecommerce, CRM, application backend, or another system |
| Minimum meaningful effect | Smallest effect worth deploying after costs and risk |
| Decision rule | How primary, guardrail, and uncertainty determine ship or reject |
| Delayed confirmation | Which long-term outcome will be reviewed after the initial decision? |
The event and identity implementation required to produce these metrics belongs in Event Tracking Plan: A Practical Framework for Connecting Traffic, Behavior, and Revenue and PostHog Implementation for Growth Lever Teams.
The assignment, exposure, denominator, and analysis checks belong in Experimentation System Audit: How to Know Whether Your A/B Test Results Can Be Trusted.
Common A/B testing metric mistakes
Optimizing the numerator and ignoring the denominator
More purchases are not useful if the treatment received more eligible traffic. Compare per randomized unit.
Conditioning on converters
Revenue per purchaser, AOV, LTV per subscriber, and close rate among attended calls can all move because the treatment changed who entered the conditional population.
Using total value by arm
Unequal group size, rollout, or missing outcomes makes totals incomparable. Use value per eligible unit.
Declaring a conversion-rate win when economics changed
Discounts, price, product mix, upsells, returns, or variable cost can reverse the result.
Treating the nearest event as the primary metric
CTA clicks, form starts, trial starts, and add-to-cart events are usually mechanism metrics.
Using an unvalidated proxy
An intuitive relationship between activation and retention is not evidence that treatment effects will align.
Comparing cohorts with unequal maturity
Later-acquired users have less time to renew, refund, close, or churn.
Hiding model uncertainty
Modeled annual LTV is not observed annual LTV. Report assumptions, validation, prediction error, and observed components.
Switching metrics after seeing the result
Predefine the primary metric and guardrails. Post-hoc exploration can generate hypotheses, not retroactively redefine the experiment.
Ignoring data quality
A sophisticated profit formula cannot rescue broken purchase events, unstable identity, exposure errors, or missing CRM outcomes.
From experiment metrics to program impact
One experiment needs the right decision metric. An experimentation program also needs consistency across time.
To measure cumulative CRO impact, include only comparable, deployed changes whose relative effects refer to a consistent primary business outcome and sequential baseline.
Do not compound:
- add-to-cart lift from one test;
- purchase conversion from another;
- revenue per visitor from a third; and
- retention from a fourth
as if they were the same unit of value.
The detailed method is in How to Measure the Cumulative Impact of Conversion Rate Optimization.
Metric discipline begins before the experiment and determines whether program-level reporting is economically meaningful later.
Frequently asked questions
What is the best primary metric for an A/B test?
The best primary metric is the highest-fidelity, sufficiently sensitive outcome that reflects incremental business or user value for every eligible randomized unit.
For commercial experiments, this is often contribution per eligible visitor, user, or account. When the full outcome is delayed, use a validated operational metric and retain the long-term outcome for confirmation.
What is the difference between a primary metric and a guardrail metric?
The primary metric defines the improvement the treatment is intended to create.
A guardrail protects another important dimension from unacceptable harm. A treatment can improve the primary metric and still be rejected because a prespecified guardrail regressed.
Is conversion rate a good A/B testing metric?
Sometimes.
It can be sufficient when the treatment cannot reasonably change order value, margin, customer quality, retention, refunds, or variable cost. It is inadequate when those economics can change.
Is revenue per visitor better than conversion rate?
Revenue per visitor is more complete because it combines acquisition probability and revenue conditional on purchase.
Contribution per visitor is better when margins, discounts, fulfillment, returns, or other variable costs differ across variants.
Why calculate value per eligible visitor instead of per purchaser?
The treatment changes who becomes a purchaser.
Calculating only among purchasers excludes non-buyers and conditions on a post-treatment event. Per-eligible-unit value captures both conversion probability and downstream value in one intention-to-treat comparison.
What metric should a subscription A/B test use?
The economic target is expected contribution LTV per eligible visitor or account.
Depending on the experiment and available horizon, the operational metric may be mature-window contribution, retained paid activation, renewal, or a validated surrogate. Paid conversion alone is sufficient only when downstream economics are stable.
What metric should a pricing A/B test use?
Use expected contribution LTV per eligible visitor or account.
Include conversion, price, retention, upgrades, downgrades, refunds, payment failures, variable service costs, and customer mix over a relevant maturity horizon.
How long should a pricing or subscription experiment run?
Long enough for the treatment-sensitive mechanisms to mature.
That may mean a refund window, several billing cycles, or a prespecified shorter horizon plus a validated residual-value model. There is no universal number of days or renewals.
Can a leading indicator determine an experiment winner?
Only when its treatment effects have been validated as a reliable surrogate for the long-term outcome in relevant experiments.
Individual-level correlation is not enough.
What should I do when the profit metric is underpowered?
Improve measurement, increase sample or duration, reduce variance, use a prespecified eligible population, test a larger coherent intervention, or use a validated surrogate.
Do not replace the business metric with an easy click merely to obtain significance.
Can an A/B test have more than one success metric?
It can measure many outcomes, but the decision hierarchy should be explicit.
Use one primary metric or a prespecified composite/decision policy, together with guardrails and diagnostics. Avoid choosing the winner by whichever metric happens to look favorable after the test.
The next useful decision
Before launching an experiment, write the economic equation and metric hierarchy.
If the easiest event can improve while contribution, customer quality, retention, or risk deteriorates, it is not the winner metric.
For help designing the measurement and experimentation system, see how 99ways approaches managed CRO and A/B testing.